Analysis Reporting Guide for Dynamics 365 Business Central
Introduction
Purpose
Microsoft is moving towards more standard reporting through Power BI and Excel. As part of this move, an Analysis Reporting mode (manual or using CoPilot for reporting) exists in all the “List” pages (e.g., Sales Orders list, Purchase Orders list, Purchase Requisition lists).
Feature Overview
Using the analysis mode allows you to “drag-and-drop” the presentation of the page columns and auto-create row totals. Page data can be grouped and filtered. The resulting output can be saved (like saving a new page filter view), and this can also be exported to Excel. In the analysis mode, the data could also be pivoted as in using Pivot tables in Excel.
Analysis Mode
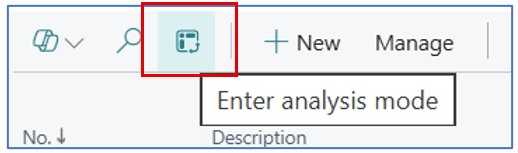
The analysis mode is accessed from the menu bar on any List page, by clicking on the Enter analysis mode analysis icon.
Once the analysis mode icon is clicked, the list page transform into a working space for analysis and data pivot. The Copilot assistance also becomes available at the bottom of the screen.
In the analysis mode, you can create different analysis views and save these to different names. These analysis views are always available when you return to the List page and enter the analysis mode.
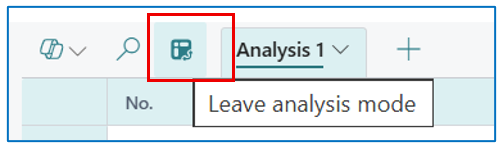
To get back to the standard list page from the analysis mode, click on the analysis mode icon again.
Example Using Sales Order
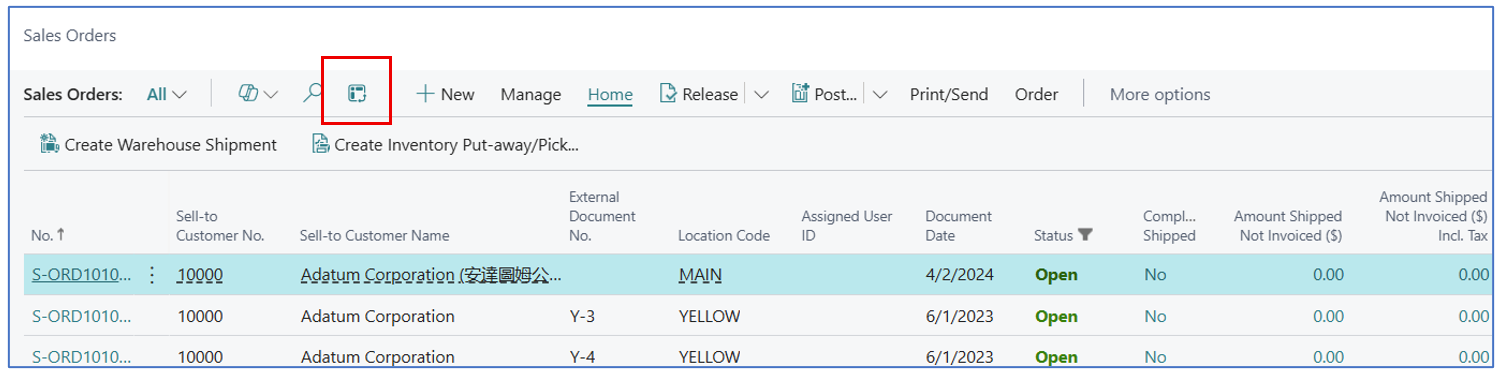
Search and navigate to Sales Order list page and select the analysis mode icon.
This opens the Analysis view with Copilot assistance displayed at the bottom of the screen.
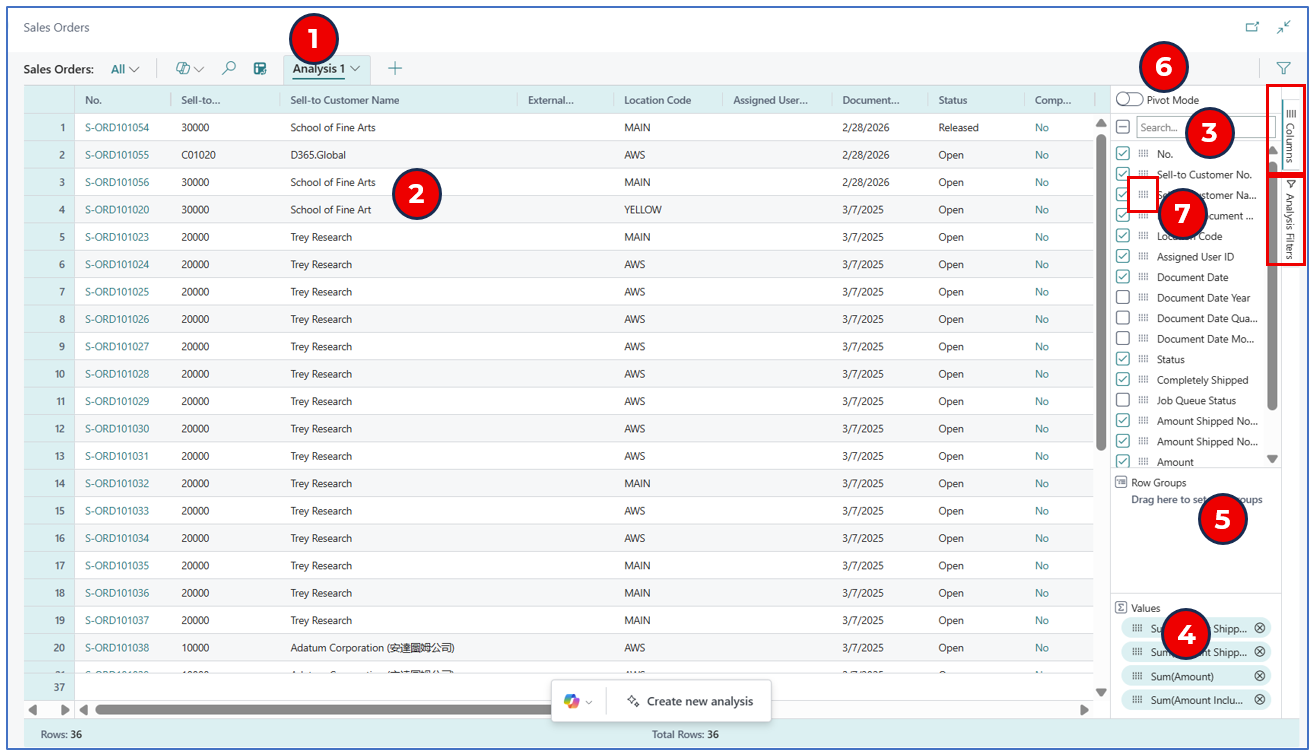
- The analysis view presents the list view records/rows in tabs (e.g. Analysis 1). These tabs are auto saved (unless deleted) and can be renamed.
- The records from the List page are displayed.
- The list of available fields (displayed as columns) is presented for selection. Check or uncheck the box next to the field name to display/remove the column displayed. Unchecking the box removes the columns so that relevant columns are displayed.
- Values – This section allows you to drag-and-drop any amount/value field from the list. Once in this section, the totals are calculated for the values e.g. sales amount per record
- Row Group – This section allows you to drag-and-drop any field to group field values for reporting presentation.
- This is the toggle button for using Pivot function in this analysis view.
Let’s take an example to improve this analysis view by grouping the sales orders by customer name and month-year as the sub-group.
-
Hover your mouse over the waffle icon next to any field name and the cursor changes to a “hand”. Use this feature to grab the field and drag it into the Row Groups section.
-
For example, drag the following fields in sequence:
- Sell-to Customer Name
- Document Date – Year
- Document Date – Month
As these fields are dragged into Row Groups, the analysis view display changes to show the grouping and the field as a label. The group and sub-groups are displayed according to the field order in Row Groups section. i.e. the top-most field is the main group, and lower fields are the sub-groups.
For each group, you can expand the grouped records using the directional arrows (up and down).
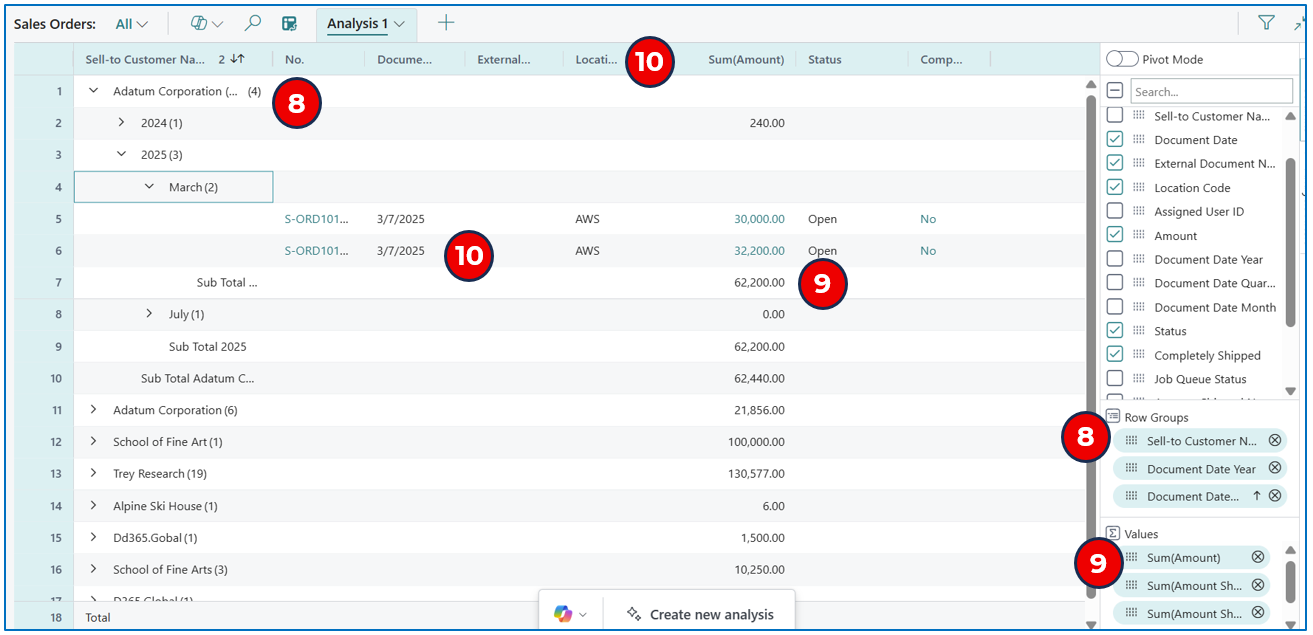
- By expanding the group/sub-groups, the totals are displayed. These field totals are derived by dragging the field into the Values section.
- The group/sub-groups can be expanded until it displays the rows. Row details are displayed in columns, and the column position can be changed with click-and-drag feature on the column title labels.
Saving the analysis view with a different name. Click on the drop-down arrow to view the menu:
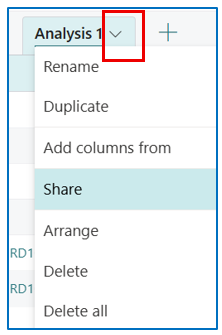
- Rename – Rename the analysis view tab.
- Duplicate – Copy the same analysis view to modify.
- Add columns from – Use this option to select hidden fields from the same source table.
- Share – Select this option to copy a URL link to this view to share with other users.
- Arrange – This option moves the tab left of right.
- Delete – This option deletes the current analysis view.
- Delete all – This option deletes all analysis views configured.
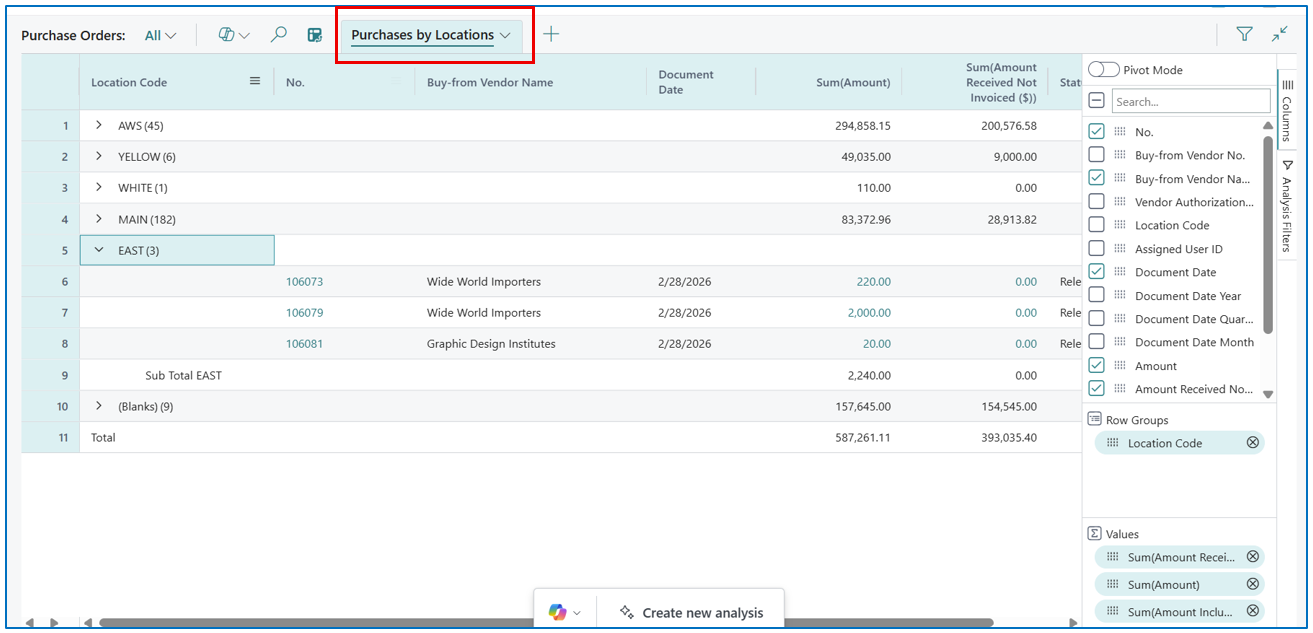
Example Using Purchase Order
Using the Purchase Orders list page, similar reporting analysis views can be achieved.
Example:
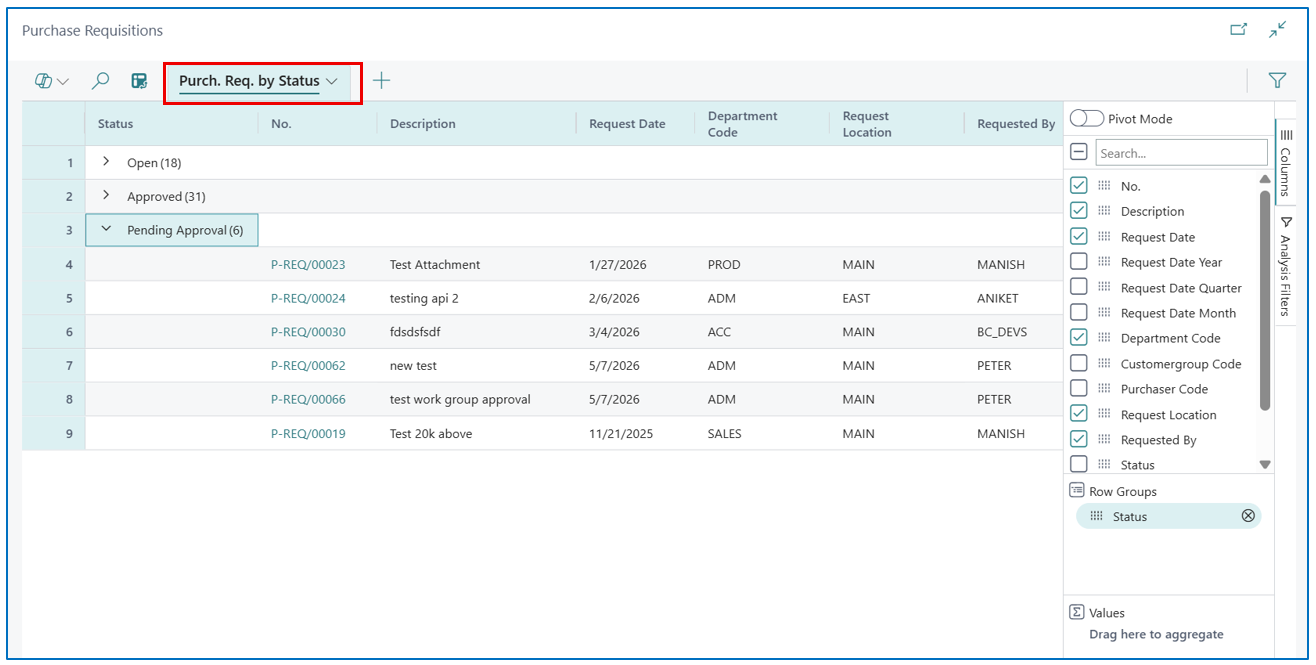
Example using Purchase Requisition
If Purchase Requisition App is installed, the Purchase Requisition page can also produce analysis reports in the same manner.
Example:
Using Copilot for Analysis
The Copilot feature in the Analysis mode is suited for AI-assisted analysis of the data presented in the List page.
Sales Order Analysis Using Copilot
In this section, we will be using Copilot tp analyse data in reporting.
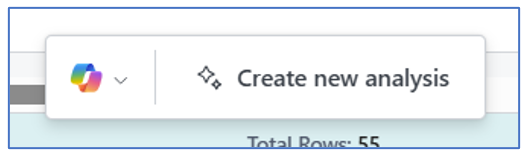
Click on Create new analysis to open the Copilot dialog box.
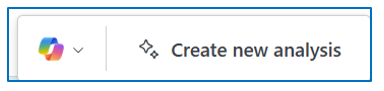
Enter a context and goal for Copilot to generate an analysis view.
For example:
Click on Generate and let Copilot structure the data.
Example:
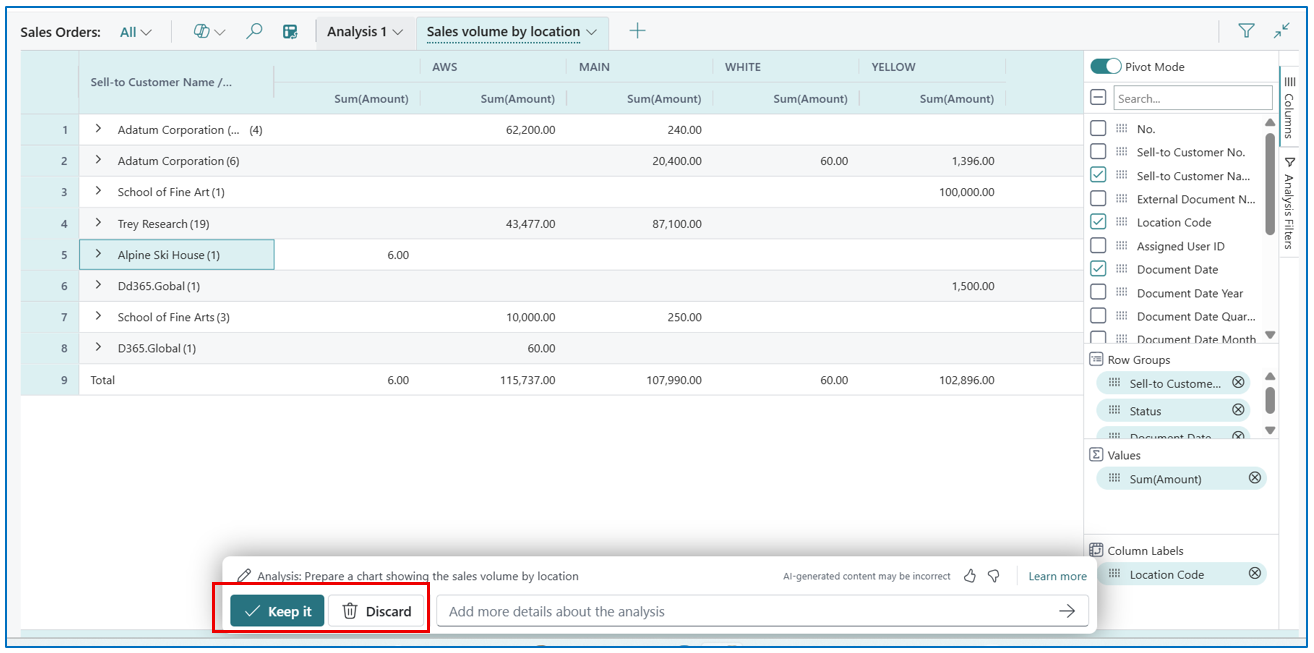
If the analysis view is appropriate, click on Keep It to let Copilot save this view. If the analysis view needs to improve, click on Discard to return to the Copilot dialog box and re-enter a more detailed statement for Copilot to interpret.
NB: You can also highlight the incorrect areas for Copilot to rectify.
Purchase Order Analysis Using Copilot
The Copilot dialog can also be used in the Purchase Orders List page or the Purchase Requisition List page.
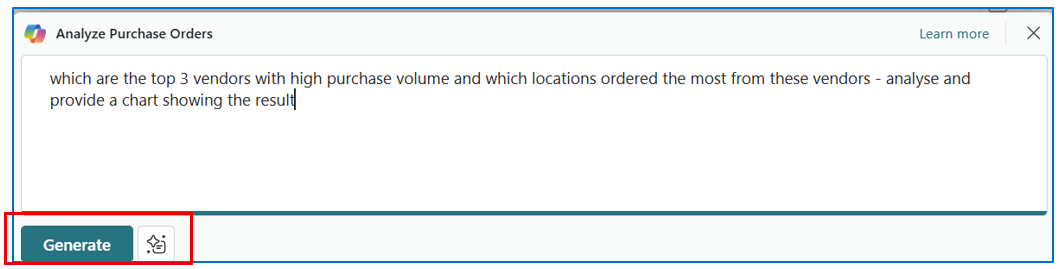
For example, enter the following request in Copilot:
This will generate the following analysis view of the Purchase Orders List page (in analysis mode).
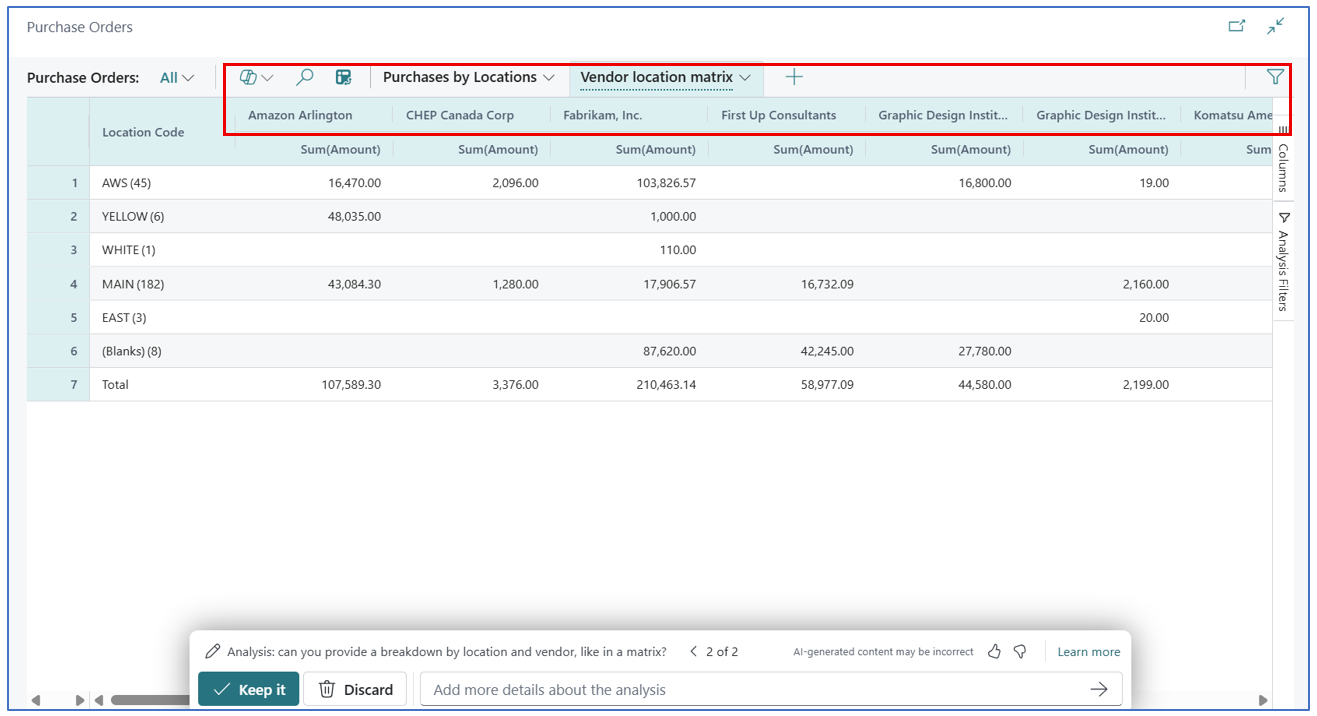
Copilot uses the data to generate analysis views. The data will likely be accurate but the presentation of data may require several iterations to fully explore Copilot’s capabilities.
Analysis View (extending) with Pivot
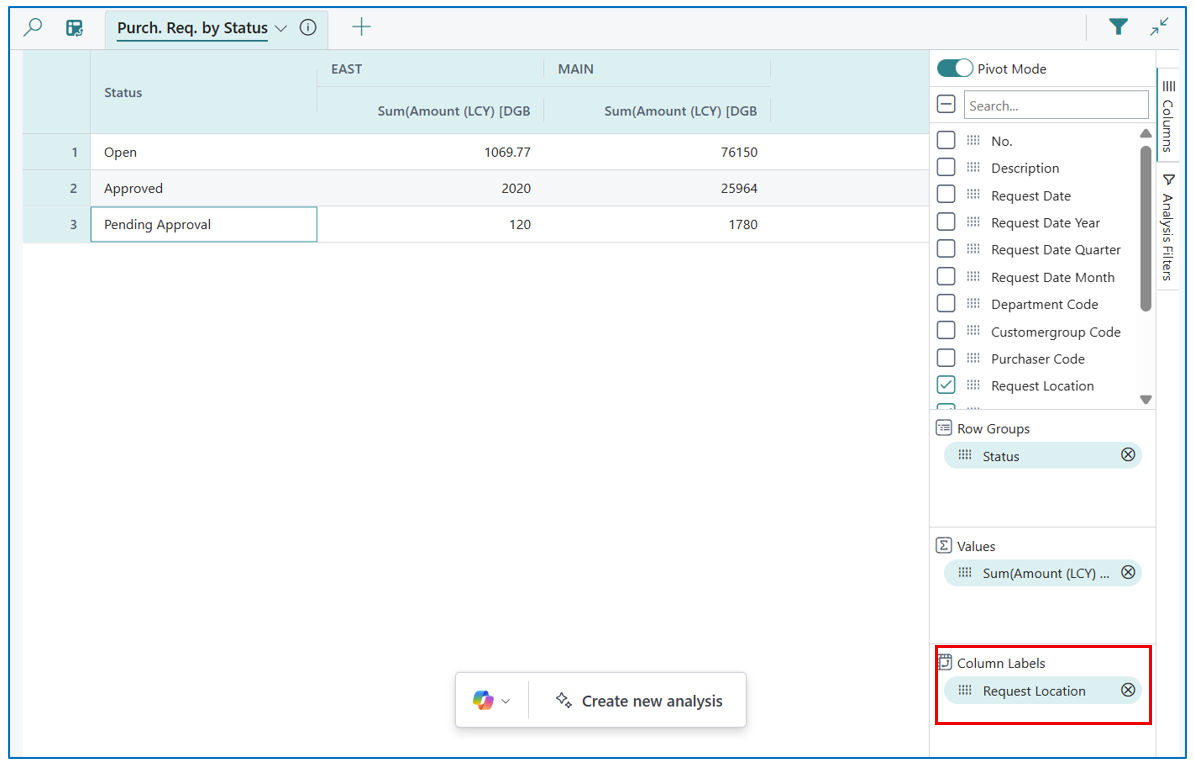
Like MS Excel, you can also use Pivot table structure in analysis view. For example (in Purchase Requisition Analysis View mode):
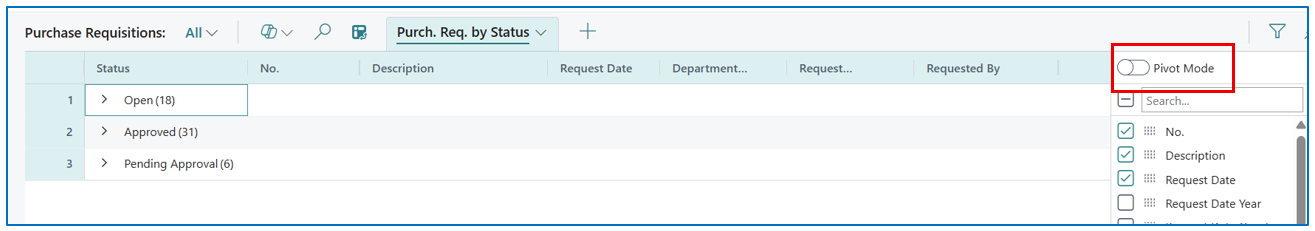
The Pivot Mode button appears on the top right corner of the analysis view. Enabling the pivot mode will result in a pivot matrix of the presented data.
A pivot matrix presents data in a row and column matrix, based on the fields used in the Row Groups (horizontal data layout) and the Column Labels (vertical data layout).
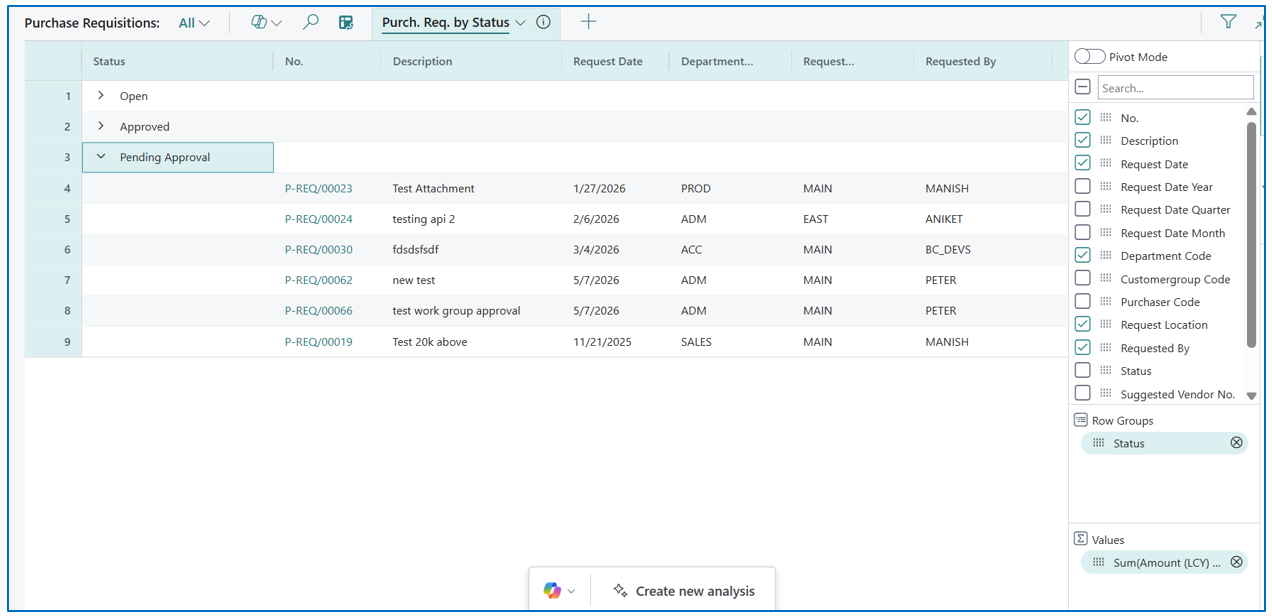
In this example, the following analysis view …
… is changed to the following matrix view with the addition of a Column Labels section:
Sharing Analysis View Reports
Analysis View provides dynamic data sets presented in tabular formats. The resulting report can be shared with other users in several ways.
Select the method from the tab menu:
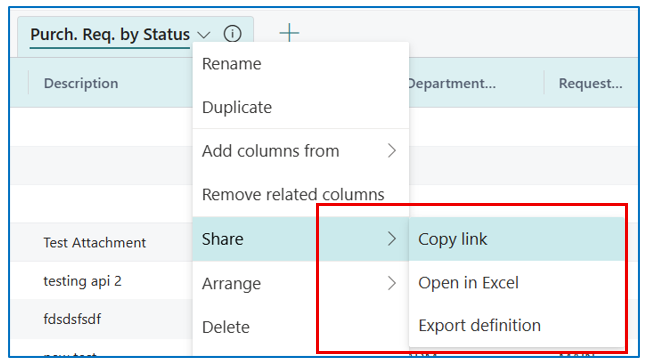
Sharing Analysis View Reports with URL Links
Select tab menu option Share > Copy Link to open the dialog box showing the URL
Example:
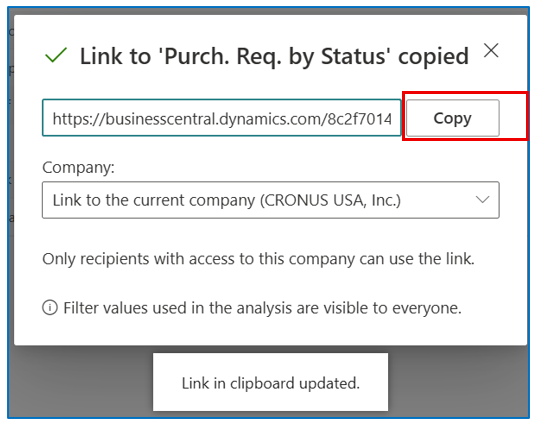
Click on the Copy button to copy the URL link to the clipboard.
NB: Recipients of the link must have access to the Business Central environment and company to view the link.
Sharing Analysis View Reports with Excel files
Select tab menu option Share > Open in Excel to export the analysis (or pivot) view into an Excel file. The view layout format is retained in the Excel file, including the pivot table if used.
Sharing Analysis View Data Structure (.json file)
Select tab menu option Share > Export definition to export the .json file to share with other users who have access rights to the Business Central environment and company.
Written By:
Peter Loo
Team Leader, Business Central
Connect on LinkedIn