Copilot for Analysis Reporting User Guide
Introduction
Microsoft Copilot in Dynamics 365 Business Central introduces an AI-powered feature called Analysis Assist. This feature fundamentally changes how you interact with operational and ledger data by letting you create custom layouts using natural language, directly bypassing the traditional workflow of exporting data to Excel to build manual pivot tables.
Instead of writing complex formulas or building data filters from scratch, you can talk to your ERP like an analyst. You can ask questions, and Copilot will generate the analysis view for you. You can also iterate on the generated analysis view by providing feedback to Copilot to refine the results.
How It Works
Copilot works hand-in-hand with Business Central’s Analysis Mode. When you run an analysis prompt, Copilot scans the current list page or query (including hidden fields and related data fields) to dynamically:
- Group and Aggregate: Summarize amounts using calculations like Sum, Count, Average, Min, or Max.
- Pivot Rows into Columns: Restructure your layout to split and organize data by dimensions such as time, region, or product category.
- Apply Multi-Tier Filters: Isolate specific thresholds, date ranges, or non-zero variables instantly.
Quick Step Guide
Here are the quick steps to use Copilot for analysis:
- Open Your Target Dataset — Prerequisite — Navigate to the list page or query you want to explore (e.g., Sales Order).
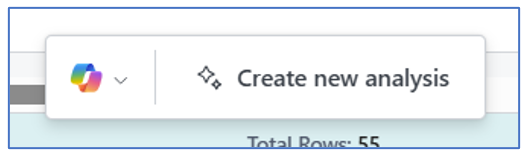
- Trigger Copilot Analysis — Action Bar — Select Copilot > Analyze list from the top action bar, or toggle Enter analysis mode manually and select Copilot > Create new analysis.
- Provide Your Prompt — Natural Language Input — In the prompt window, describe your target layout in plain English (e.g., “Show total sales by customer pivoted by calendar year”).
- Review & Refine — Iterative Adjustments — Click Generate. Copilot will open a new analysis tab with your requested data layout. You can type follow-up details to adjust the view or click Keep It to permanently save the tab to your page view.
Analysis Mode
The Analysis Mode is accessed from the menu bar on any List page, by clicking on the Enter analysis mode analysis icon.
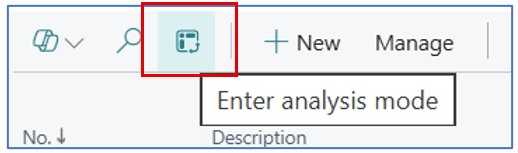
Once the analysis mode icon is clicked, the list page transform into a working space for analysis and data pivot. The Copilot assistance also becomes available at the bottom of the screen.
In the analysis mode, you can create different analysis views and save these to different names. These analysis views are always available when you return to the List page and enter the analysis mode.
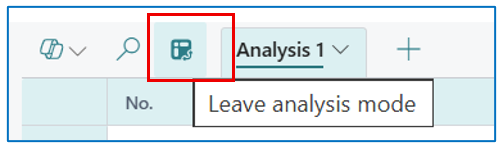
To get back to the standard list page from the analysis mode, click on the analysis mode icon again.
Using Copilot for Analysis
In this section, we will use the Copilot feature in Analysis Mode that is suited for AI-assisted analysis of the data presented in the List page used for Sales Order, Purchase Order, and Purchase Requisition.
Sales Order Analysis Using Copilot
In this section, we will be using Copilot to analyse data in reporting.
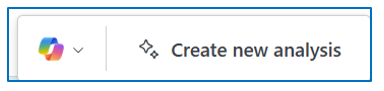
Click on Create new analysis to open the Copilot dialog box.
Enter a context and goal for Copilot to generate an analysis view.
For example:
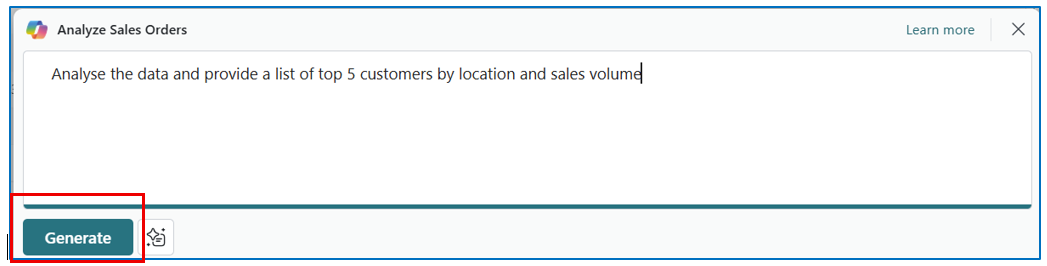
Click on Generate and let Copilot structure the data.
Example:
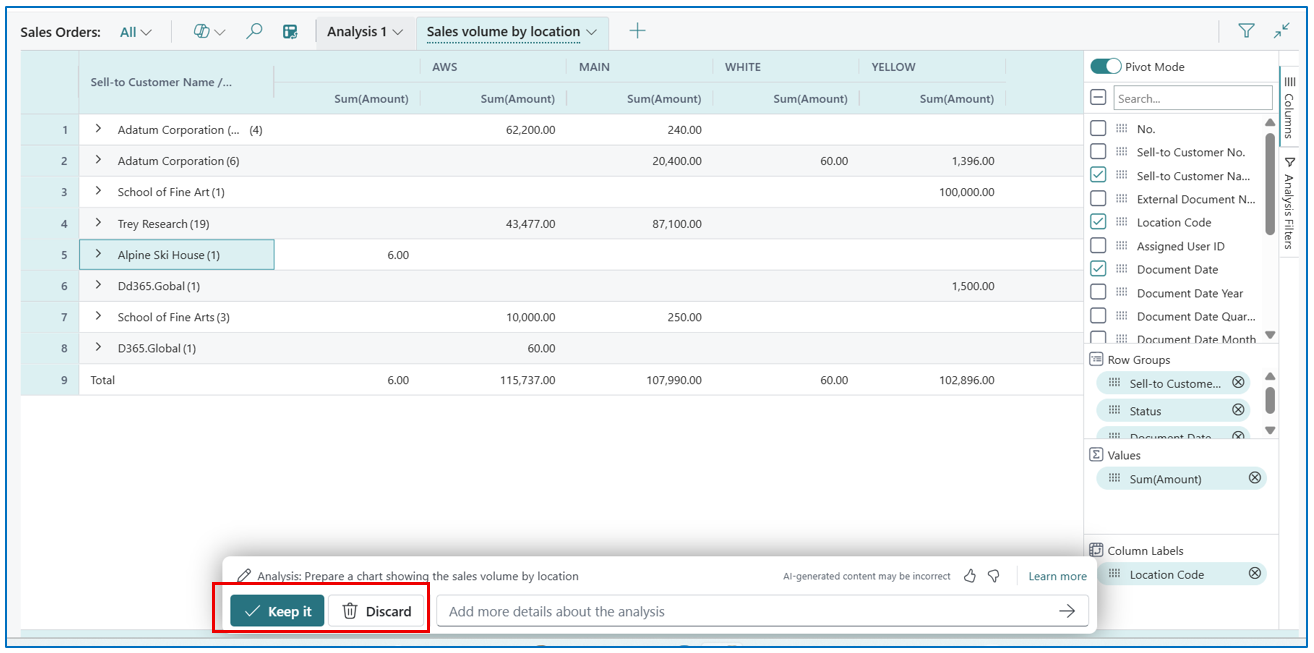
If the analysis view is appropriate, click on Keep It to let Copilot save this view. If the analysis view needs to improve, click on Discard to return to the Copilot dialog box and re-enter a more detailed statement for Copilot to interpret.
NB: You can also highlight the incorrect areas for CoPilot to rectify.
Purchase Order Analysis Using Copilot
The Copilot dialog can also be used in the Purchase Orders List page or the Purchase Requisition List page.
For example, enter the following request in Copilot:
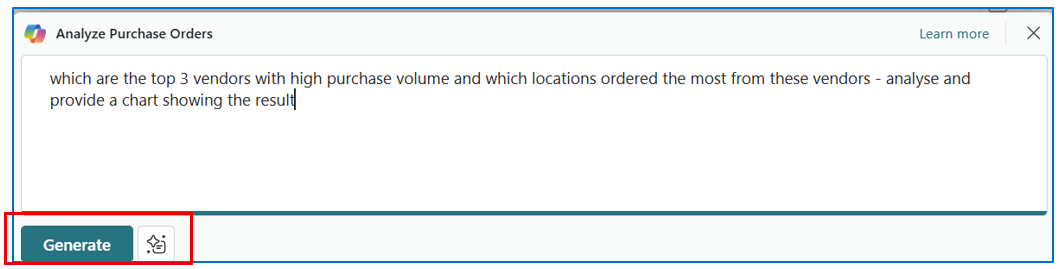
This will generate the following analysis view of the Purchase Orders List page (in analysis mode).
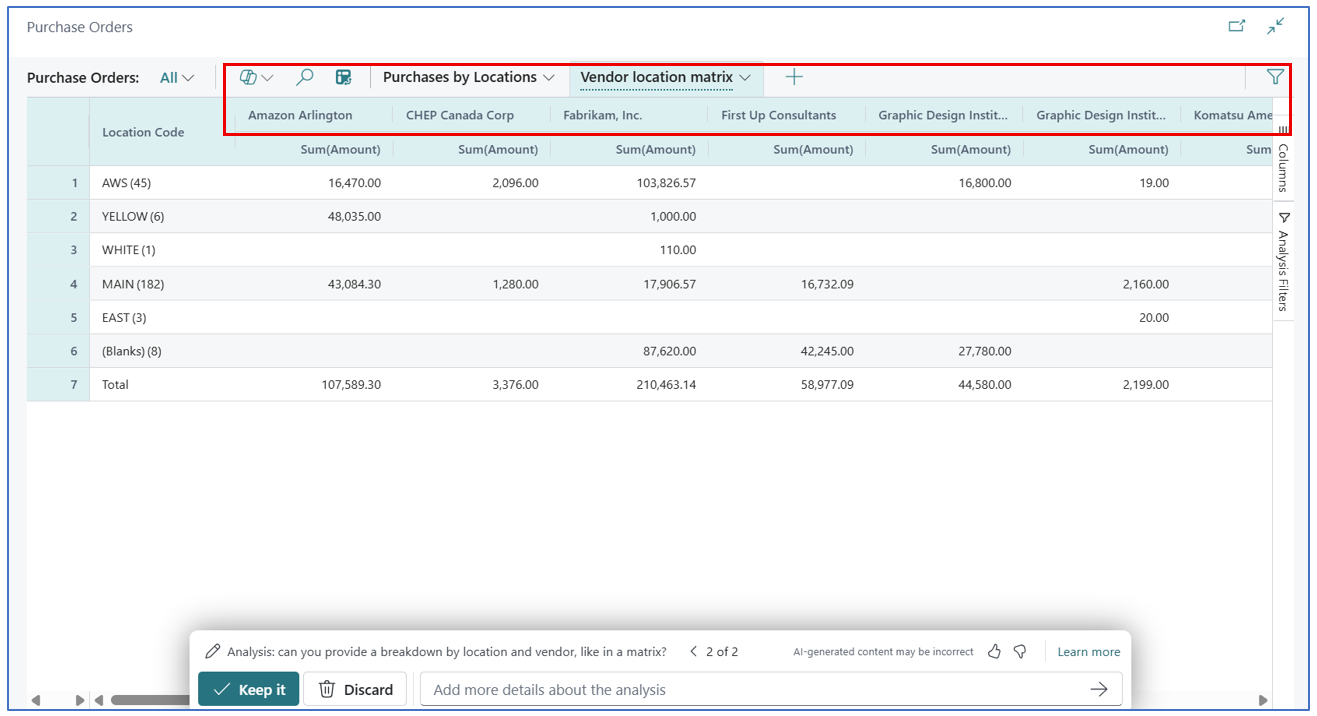
Copilot uses the data to generate analysis views. The data will likely be accurate but the presentation of data may require several iterations to fully explore Copilot’s capabilities.
Analysis View (extending) with Pivot
Like MS Excel, you can also use Pivot table structure in analysis view. For example (in Purchase Requisition Analysis View mode):
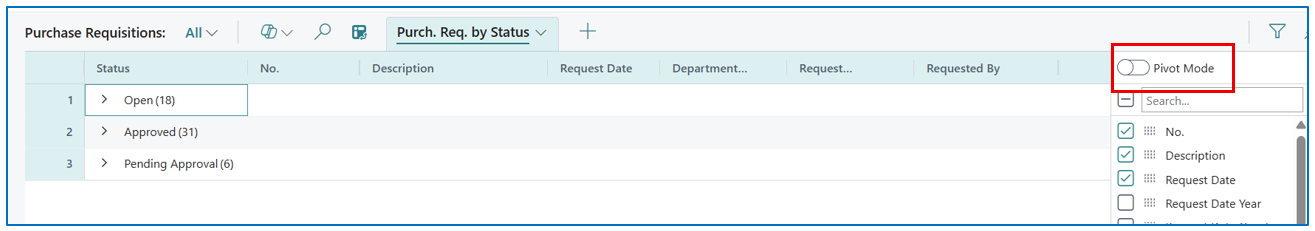
The Pivot Mode button appears on the top right corner of the analysis view. Enabling the pivot mode will result in a pivot matrix of the presented data.
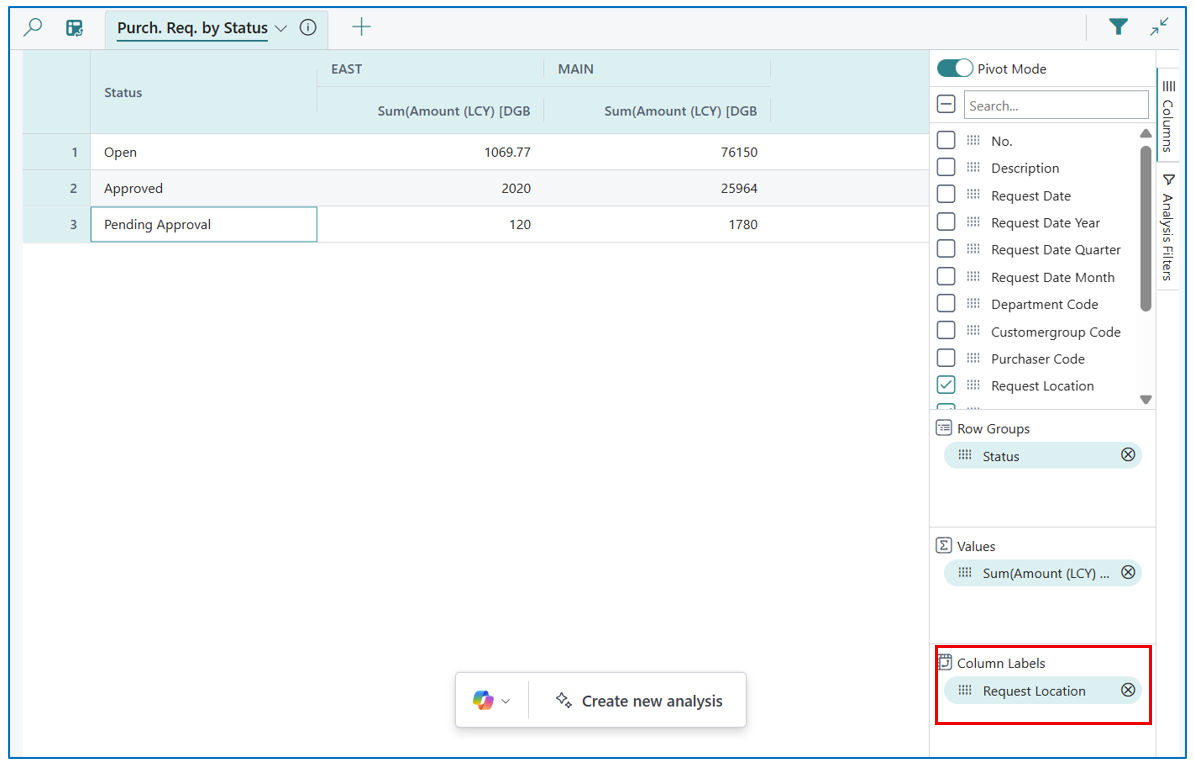
A pivot matrix presents data in a row and column matrix, based on the fields used in the Row Groups (horizontal data layout) and the Column Labels (vertical data layout).
In this example, the following analysis view …
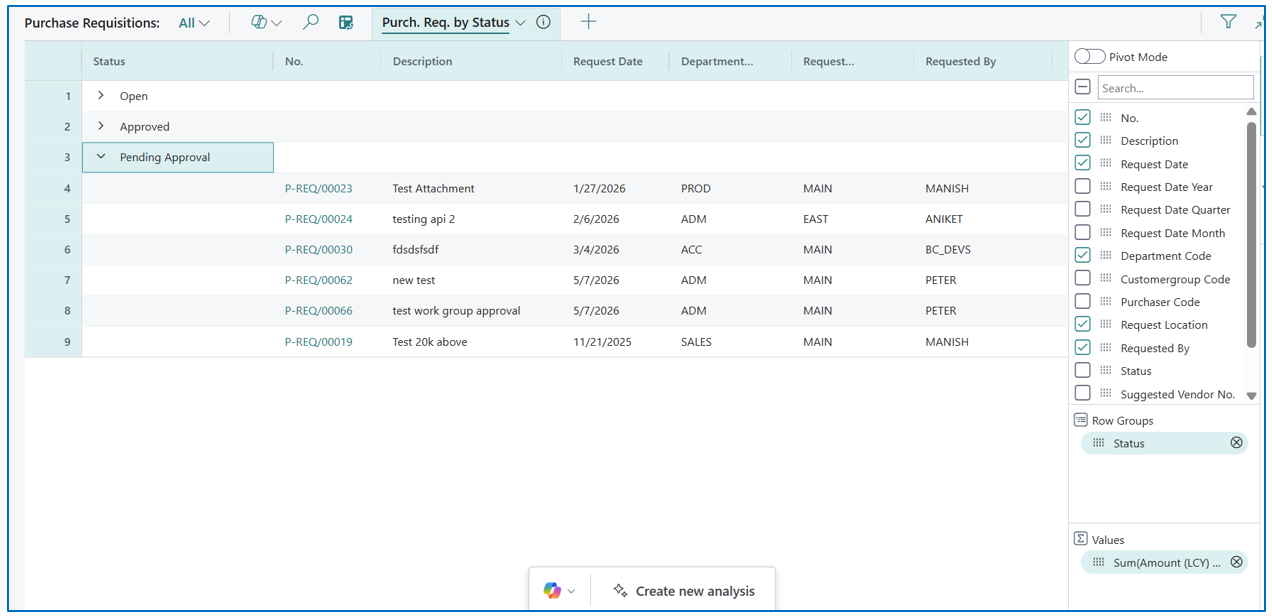
… is changed to the following matrix view with the addition of a Column Labels section:
Summary
At the end of the day, using Copilot for reporting in Business Central completely changes how you interact with your business data. It takes the dread out of data digging by acting like a helpful assistant who builds your reports for you. Instead of spending your afternoon clicking through complicated menus, exporting massive spreadsheets, and wrestling with Excel pivot tables just to get a basic answer, you can simply ask for what you need in plain English. It turns a tedious, multi-step chore into a quick, natural conversation.
The real magic happens when you start using it as a daily shortcut. Because it’s so fast to spin up a new view, you can ask quick, curious questions about your sales, inventory, or balances without worrying about ruining a master spreadsheet or breaking a formula. It saves you time, clears out the headache of manual data prep, and lets you get straight to the answers you need to run your business smoothly.